Did you know nearly 70% of businesses don’t analyze the data they collect every day? Many owners see their checkout systems as just cash registers, missing out on valuable insights. By mastering retail pos sales reporting, we can make informed decisions that boost profits.
Your POS data is more than just sales records; it’s the lifeblood of your business. By understanding these numbers, we uncover patterns that affect our profit margins. This new way of thinking is key for any owner aiming to grow.
We think turning raw data into a strategic tool is the quickest way to retail business growth. By focusing on actionable insights, we can better manage inventory and keep customers coming back. Using POS data helps us protect our profit margins and drive sustainable retail business growth in a tough market.
Key Takeaways of Retail POS Sales Reporting
- Understand the untapped value hidden within your daily transaction logs.
- Learn to convert raw numbers into clear, strategic business decisions.
- Identify specific trends that directly impact your bottom line.
- Use analytical insights to optimize inventory and reduce waste.
- Build a foundation for long-term success through data-driven management.
The Foundation of Retail POS Sales Reporting
Your journey to higher profits starts with how you track and understand every sale. Having a solid retail pos sales reporting plan is now a must for store owners. It connects daily activities to long-term financial success.
Understanding the Value of Transactional Data
Every purchase by a customer gives you valuable information. This POS data is more than just sales numbers. It shows what products customers like, when they shop, and how they buy.
By looking at these details, we get a better view of our business. This helps us stop guessing and start making informed decisions based on real data.
Why Manual Spreadsheets Are Holding You Back
Many stores use manual spreadsheets to track sales. While it might seem cheap, it slows down operational efficiency. Mistakes in manual entry can mess up inventory and financial reports.
Also, updating these spreadsheets takes a lot of time. This means you can’t make data-driven decisions fast enough. The table below shows why automated systems are better than manual tracking.
| Feature | Manual Spreadsheets | Automated POS Systems |
|---|---|---|
| Data Accuracy | High risk of human error | High precision and consistency |
| Reporting Speed | Delayed and reactive | Instant and proactive |
| Scalability | Limited and labor-intensive | Seamless and automated |
| Inventory Sync | Disconnected from sales | Real-time updates |
Setting Up Your Data Collection Infrastructure
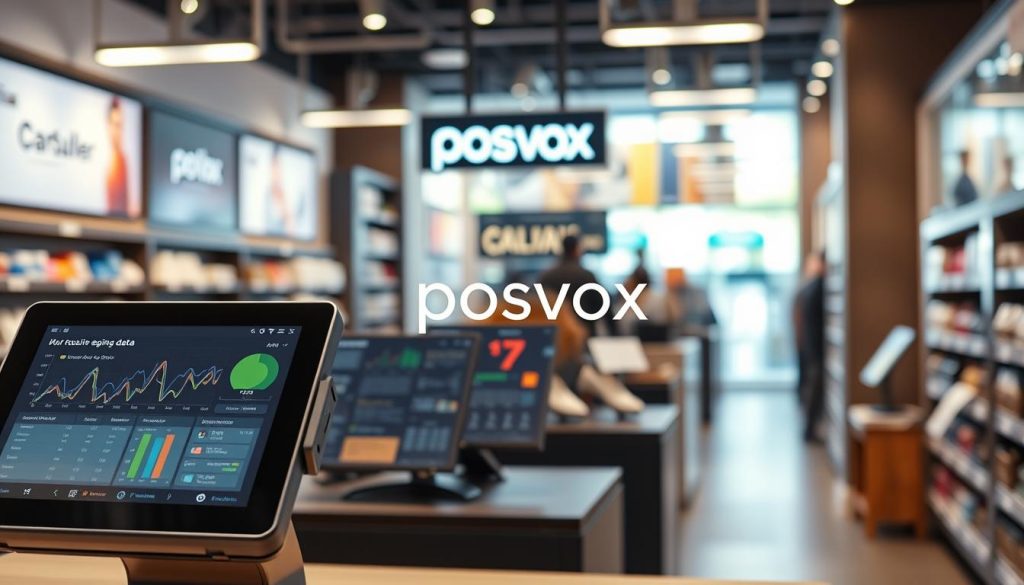
Creating a strong data pipeline is key to turning POS data into profit. We need to move from just reporting to proactive management. A good setup makes sure every transaction is right and flows well into our reports.
Choosing the Right POS System for Data Integrity
The quality of our retail analytics starts with our POS choice. We look for POS software with strong audit trails and checks. This keeps our data accurate and prevents errors.
We also check for systems with detailed user permissions. This keeps our financial reports accurate by limiting who can change data. Consistency in data entry comes from systems that enforce strict rules.
Integrating Your POS with Analytics Software
Good POS integration connects daily sales to long-term plans. By linking our POS to analytics platforms, we avoid manual data exports. This makes data-driven decisions faster and more reliable.
We choose tools with native API support for our systems. This keeps inventory, customer info, and sales figures in sync. This integration makes our POS a key tool for business insights.
Ensuring Real-Time Data Synchronization
Real-time data is key for modern retail. We use cloud-based sync to keep POS data up to date everywhere. This stops problems like “ghost inventory” in fragmented systems.
Having one source of truth lets us quickly respond to market changes. Whether adjusting prices or restocking, our data-driven decisions are always current. Below is a table showing the main parts of a top-notch data setup.
| Infrastructure Component | Primary Benefit | Implementation Priority |
|---|---|---|
| Cloud-Based POS Software | Real-time synchronization | High |
| Automated API Connectors | Seamless POS integration | High |
| Centralized Analytics Dashboard | Improved retail analytics | Medium |
| Encrypted Data Backups | Enhanced data security | Critical |
Identifying Key Performance Indicators for Profitability
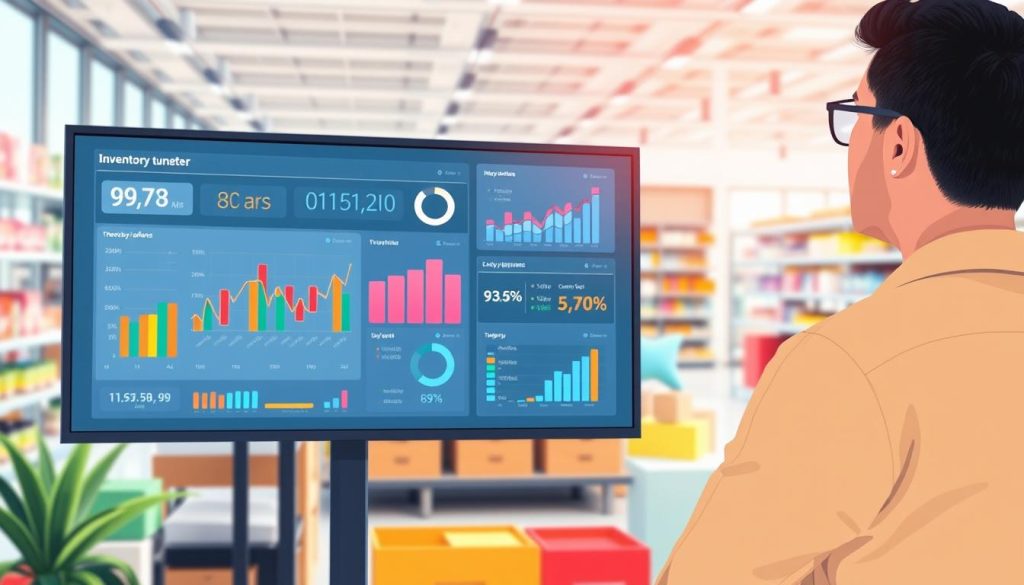
Tracking your business performance starts with identifying the metrics that truly impact your bottom line. By focusing on specific retail KPIs, we can gain a clearer picture of our store’s financial health and operational efficiency. This data-centric approach allows us to allocate resources toward the most profitable areas of our business.
Tracking Gross Margin Return on Investment
Gross Margin Return on Investment, or GMROI, is a vital metric for evaluating how effectively we turn our stock into cash. It measures the profit generated by every dollar invested in inventory. High GMROI scores indicate that our inventory management strategy is working well to maximize returns.
When we monitor this metric, we can easily identify which products provide the best value. If a category shows a low return, we know it is time to adjust our purchasing habits. This helps us maintain healthy profit margins throughout the fiscal year.
Monitoring Average Transaction Value and Units Per Transaction
To boost revenue, we must look closely at Average Transaction Value (ATV) and Units Per Transaction (UPT). These metrics reveal how much our customers spend per visit and how many items they purchase at once. By analyzing these sales trends, we can train our staff to suggest relevant add-ons effectively.
Increasing these numbers often requires simple changes to our floor layout or checkout process. When we see a dip in UPT, we know it is time to refresh our cross-merchandising displays. This proactive stance keeps our revenue streams consistent.
Analyzing Sell-Through Rates by Product Category
Sell-through rates help us understand the speed at which we move stock from our shelves to our customers. By tracking this data, we can optimize our inventory turnover and avoid holding onto stagnant items. We categorize our products to see which lines are performing best in real-time.
| Metric | Primary Goal | Impact on Profit |
|---|---|---|
| GMROI | Maximize Return | High |
| ATV | Increase Spend | Medium |
| UPT | Boost Volume | Medium |
| Sell-Through | Clear Stock | High |
Using these indicators ensures that our business remains agile in a competitive market. We rely on these numbers to make informed decisions that protect our long-term growth. Consistent monitoring is the key to sustained success.
Cleaning and Organizing Your POS Data
Your business intelligence is only as good as the data it’s based on. Cluttered or inconsistent records make POS data hard to understand. This can lead to bad decisions. We focus on keeping your data clean to ensure reports are accurate and helpful.
“Data is a precious thing and will last longer than the systems themselves.”
Standardizing Product Categorization and Naming
Keeping things consistent is key to good inventory management. If items are labeled differently, like “Blue Denim Jeans” versus “Denim Jeans – Blue,” it messes up your system. We suggest using a clear naming system that includes brand, style, color, and size.
This makes it easier for your POS software to sum up sales correctly. With everything labeled the same way, tracking sales across different items becomes much simpler.
Removing Duplicate Entries and Ghost Inventory
Ghost inventory happens when your system shows stock that’s not really there. This usually comes from duplicate entries or sync issues. We need to get rid of these errors to avoid over-ordering and lost sales.
The table below shows how bad data can hurt your business compared to clean data:
| Metric | Unorganized Data | Cleaned Data |
|---|---|---|
| Inventory Accuracy | 65% | 98% |
| Reorder Efficiency | Low | High |
| Reporting Speed | Slow | Instant |
Establishing a Consistent Data Entry Protocol
To keep your business thriving, we need a strict data entry rule. Every employee should know how to enter new items correctly the first time. Modern POS software can help make these tasks easier and cut down on mistakes.
Creating a simple checklist for employees can help. When everyone follows the same steps, your operational efficiency stays high. Your reports will be reliable, helping your business make better decisions.
Analyzing Sales Trends to Optimize Inventory
We can turn sales data into a powerful tool for inventory management. By looking at sales trends, we can make better buying choices. These choices help our retail business grow over time.
Identifying High-Velocity Versus Slow-Moving Items
Not all products are created equal. We use retail analytics to sort items by how fast they sell. This way, our best-sellers are always ready for customers.
“Inventory is money sitting around in another form.” — Rhonda Abrams
Slow-moving items can block money that could be used for in-demand items. We spot these items early. Then, we clear them out to free up space and cash.
Using Seasonal Data to Forecast Future Demand
Forecasting demand is easier with historical data. We study past sales trends to get ready for busy seasons. This keeps our inventory turnover rate healthy all year.
| Metric | High-Velocity | Slow-Moving |
|---|---|---|
| Restock Frequency | Weekly | Quarterly |
| Profit Margin | High | Low |
| Storage Priority | Primary | Secondary |
Reducing Carrying Costs Through Data-Driven Reordering
Too much stock means extra storage costs and old items. We use retail analytics to order just what we need. This keeps our stock lean and fresh.
This careful approach to inventory management boosts our inventory turnover. A lean operation means we can grow our retail business in a sustainable way.
Leveraging Customer Purchase Patterns for Targeted Marketing
We can turn transaction logs into a powerful tool for personalized marketing. By studying customer behavior, we create real connections with our shoppers. This approach is key to keeping customers and making the most of their value.

Segmenting Customers Based on Buying Frequency
Our shoppers don’t all interact with us the same way. We sort them by how often they shop and how much they spend. This helps us find our most loyal customers and those who only shop during sales.
- VIP Shoppers: Frequent buyers who respond well to early access.
- Occasional Visitors: Customers who need a nudge to return.
- Lapsed Customers: Shoppers who have not visited in over six months.
Creating Personalized Promotions Using Purchase History
With our segments in place, we can make offers that really speak to our audience. We use past purchases to suggest new products. This personal touch makes customers more likely to buy again.
“The goal is to provide value at every touchpoint, ensuring that our marketing feels like a helpful suggestion, not an intrusive ad.”
Measuring the ROI of Marketing Campaigns via POS Integration
Our POS integration is key to analyzing our marketing. By linking our marketing to sales, we see which campaigns bring in money. No more guessing if a promotion worked; the data shows us.
We keep an eye on important metrics to make sure our marketing is worth it. By regularly checking these numbers, we improve our customer retention and make our marketing budget work harder. This cycle keeps our business quick to adapt and ready for the market.
Evaluating Staff Performance Through Transactional Data
We think objective data is the best way to see how your team affects store success. By focusing on facts, we can really understand each employee’s role. This helps us build a culture of responsibility and ongoing betterment.
Linking Individual Sales IDs to Performance Metrics
Every sale should be linked to a staff member. This way, we can track retail KPIs like total sales per shift and average transaction value. It shows us who’s doing well and who might need help.
Looking at these numbers, we find out who stands out. Consistency is important, and data helps us reward those who consistently do great. This fair approach makes sure everyone knows how they contribute to the business.
Identifying Training Opportunities Through Transaction Gaps
When we see big gaps in sales, it tells us where we need to improve. If an employee isn’t converting visitors into customers, they need training. Fixing these issues helps keep customers coming back.
We make special training plans based on what each team member needs. Whether it’s knowing more about products or how to sell, data guides us. This way, we turn weaknesses into strengths that build loyalty.
Incentivizing Upselling Based on Objective Data
Knowing customer behavior is key to upselling. We track who’s good at suggesting extra items and share their strategies. Incentives should be based on real results, not just sales numbers.
We set specific, data-driven goals for upselling that match our business goals. When staff sees their efforts rewarded, they’re more likely to sell more. This creates a cycle where everyone wins thanks to data-driven growth.
Automating Your Reporting Workflow
We can change how we run our business by using automated reporting. This makes our work easier and cuts down on mistakes. It lets our team focus on big ideas, not just doing the same thing over and over.
Scheduling Automated Daily and Weekly Reports
Being consistent is key for good retail analytics. Set your POS system to send daily reports to your email. These reports should show important retail KPIs like sales, transactions, and labor costs.
Weekly reports give a bigger picture of your sales trends. They help us spot patterns we might miss in daily reports. By automating these, everyone stays up to date without having to check the system themselves.

Setting Up Alerts for Inventory Thresholds
Managing inventory well stops lost sales and cuts costs. We set alerts for when stock levels get low. This way, we can order more of popular items before they sell out.
- Real-time notifications: Get emails or SMS alerts right away for low-stock items.
- Automated reorder points: Start purchase orders automatically based on how fast items sell.
- Waste reduction: Find out which items aren’t selling well before they become a problem.
Utilizing Dashboards for Instant Business Visibility
Modern dashboards are like the control center for our retail. They let us see sales trends live and make quick decisions. These tools make complex data easy to understand with charts that show our most important retail KPIs.
With these tools, we can quickly change how we work. We can move staff around or change prices during busy times. Being able to act fast is now a must for keeping up in today’s fast market.
Troubleshooting Common Reporting Discrepancies
Even the best POS software can have issues that affect your reports. When your numbers don’t match what’s real, you need to act fast. Keeping things consistent is key to a reliable business.

Reconciling Cash Drawer Variances
Cash drawer issues often come from counting mistakes or wrong starting amounts. We suggest doing a blind count at the end of each shift to keep staff honest. If the problem doesn’t go away, look at the transaction logs for clues like voids or refunds.
Addressing Technical Glitches in Data Export
At times, the problem is with your POS integration, not your team. If your data isn’t syncing with your accounting, check your internet and API settings first. Regularly checking these connections helps avoid long-term reporting gaps.
Verifying Data Accuracy During System Updates
System updates are important for security but can mess with your inventory management. We recommend running a test report right after an update to check product counts. Watching customer behavior during these times can also reveal software issues.
| Issue Type | Primary Cause | Resolution Step |
|---|---|---|
| Cash Variance | Manual entry error | Perform blind shift counts |
| Export Failure | API connection timeout | Refresh integration tokens |
| Data Mismatch | Update sync lag | Verify database timestamps |
| Inventory Gap | Ghost stock entries | Run a physical cycle count |
Conclusion
Successful retail management is about turning raw POS data into useful insights. These insights help boost profit margins and keep customers coming back. They are key for your whole team’s success.
Switching from just reporting to using data to guide your actions changes everything. Regularly checking your retail pos sales reporting gives you a big advantage. It helps your business grow and stay ahead of the competition.
Tools like Shopify and Lightspeed make tracking these important metrics easy. They help you make smart choices that keep your profits up.
Start using these strategies now to see big improvements in how your store runs. Being accurate with your data will show real results for your business.
Begin by reviewing your current reporting process this week. Better data means better results for your team and customers.